
Software Tools
Our software tools were carefully tested by accredited measurement laboratories. These tests confirmed high accuracy of the simulation results compared to the measurements.
Thermal Network Analysis
TNA tools model electrical cables and components as thermal networks
composed of RC elements and compute the time‑ and space‑dependent
temperature T(x, t). They support sensitivity studies, hot‑spot identification and early
design decisions.
- Core functions
- Physical model: RC networks for cables and components.
- Results: Temperature histories
T(x, t), hot‑spot maxima, gradients, permissible current‑carrying capacity. - Studies: Sensitivity and parameter studies (materials, geometry, load profiles, boundary conditions).
- Hot‑spot capture
- Connectors, crimps, cross‑section changes, bundle expansions, terminals.
- Model variable environments
- Sections with different convection/insulation, mounting points, heat dissipation to housings/heat sinks.
- Network and system level
- Coupled thermal networks of multiple cables/components: ideal for wiring harnesses, modules, and subsystems.
- Role in the workflow
- From pre‑design to detail: From rapid variant screening to detailed component analysis.
- Interaction with RTA tools: Used as detailed follow‑up; import/export of boundary conditions and parameters.
- Standards orientation: Inputs and outputs aligned with
- DIN 70101: "Thermal simulation models for vehicle electrical systems"
- ZVEI Guideline TLF 0101: "Thermal simulation models"
- Typical outputs
- Time series and profiles of temperatures/power, thermal RC equivalents for follow‑up simulations.
FTNA Tool (Fast Thermal Network Analysis) (in development)
The FTNA tool supports system-level thermal analysis. The implemented accelerated RC‑network solver enables very short simulation times, with good accuracy. This is achieved through a suitable nonlinear interpolation method that ensures consistent resolution between thermal nodes. It is therefore suitable for simulating larger and more complex systems such as wiring harnesses, control units, or vehicle subsystems early in the design phase.
+- Applications & Benefits
- System-level simulation: Analyze the thermal behavior of connected systems and components.
- Fast “what‑if” scenarios: Significantly reduced computation times enable comprehensive parameter studies and design optimizations.
- Analysis of dynamic load cycles: Simulation of time‑dependent current profiles to assess behavior under realistic conditions.
- Early detection of bottlenecks: Identify and mitigate system-wide thermal hot-spots and critical coupling effects before physical prototypes are built.
- Key Technology
- Accelerated RC-Solver: A powerful engine designed for speed and stability on large, complex thermal networks.
- Precise interpolation: Nonlinear interpolation for calculating temperature distribution between discrete thermal nodes. This technique provides a detailed thermal profile without additional nodes, preserving accuracy while minimizing model complexity.
- Designed for complexity: Supports modeling of bundles, branches, and varying environmental zones.
- Inputs
- System topology: Define complex network structures, including cable bundles, connectors, and component connections.
- Material & geometry: Parameterization of thermal nodes (RC elements).
- Operational data: Time‑varying load profiles and dynamic boundary conditions for realistic simulations.
- Computations & Results
- System‑wide temperature maps: Spatially resolved temperatures for any time step, providing a complete thermal picture
T(x, y, t). - Hotspot localization:Automatic identification of the hottest points across the entire system.
- Thermal coupling effects: Quantify heat transfer between adjacent cables and components.
- System‑wide temperature maps: Spatially resolved temperatures for any time step, providing a complete thermal picture
- Visualization & Analysis
- Interactive network graphs: Visualize the thermal grid with nodes and edges colored by temperature, showing clear, interpolated heat distribution.
- Time‑series plots: Display of temperature trends at selected nodes.
- Animated heat propagation: Optional animations of temperature changes over time.
- Exports: Save plots and create reports for documentation and reviews.
- Standards & Interoperability
- Industry-standard compliance: Designed for structured data exchange with inputs and outputs aligned with DIN 70101 and the ZVEI Technical Guideline for thermal simulation models.
- Sustainable workflow: Using common standards for model parameterization supports durable design and simulation processes.
- System integration: Generates standardized thermal equivalent networks (RC models) for easy integration into other system-level or multi-physics simulation environments.
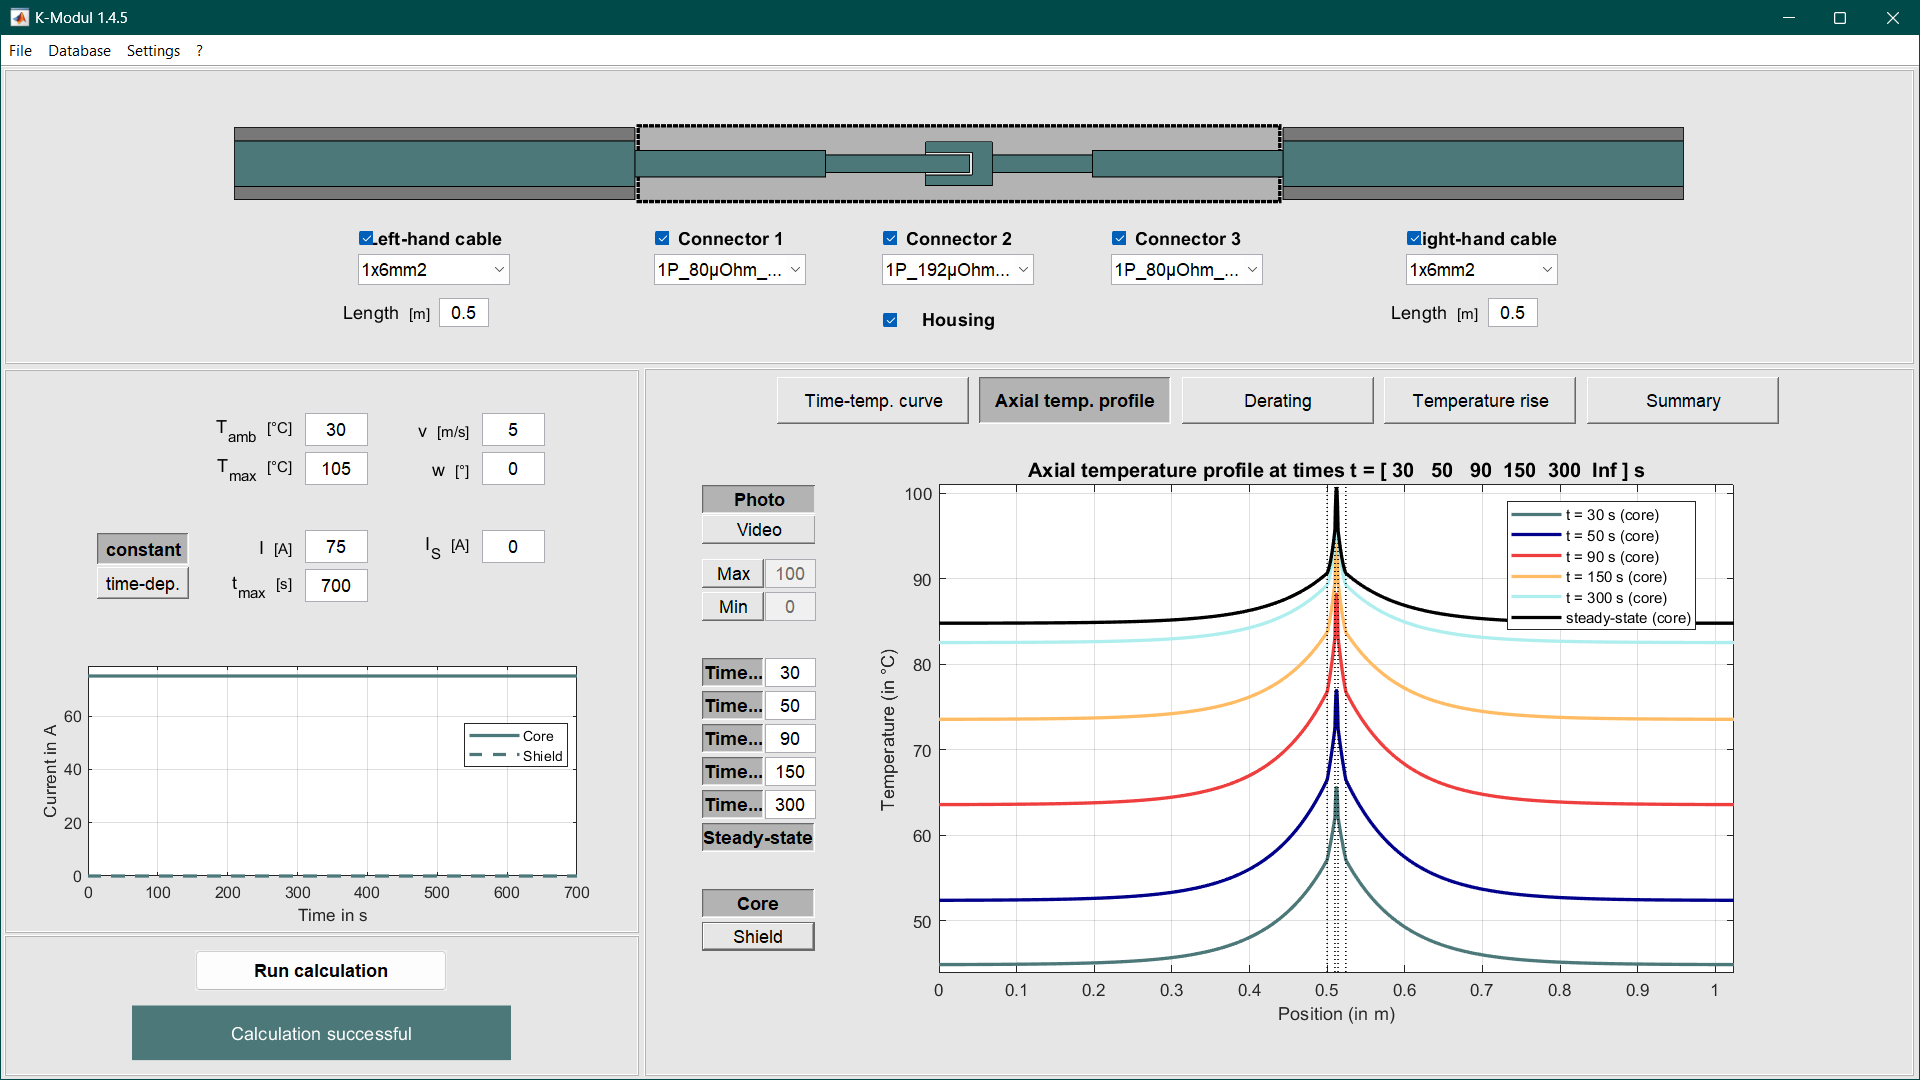
K‑Modul
The K‑Modul supports modular configuration and analysis of contact systems by selecting and combining connectors, housings, and connection cables. It enables fast and precise calculations for constant and time‑dependent current loads with clear, verifiable result presentation.
+
- Applications & Benefits
- Rapid variant creation of contact systems through modular selection.
- Assessment of thermal and electrical stress under realistic operating conditions.
- Design based on derating specifications and limit temperatures.
- Traceable documentation for reviews, approvals, and standards compliance.
- Inputs
- Contact system: Connector type, housing, contact geometry, material data, contact resistances.
- Connection cables: Conductor cross‑section, material, insulation structure, length, thermal coupling.
- Operation: Current load profile (constant/time‑dependent), ambient temperature, boundary conditions/cooling.
- Calculations & Outputs
- Temperatures: Spatially and temporally resolved temperature profiles, worst‑case, boundary temperatures.
- Derating: Current‑to‑temperature characteristic curves and permissible continuous currents.
- Electrical: Voltage drops and power losses per contact and for the entire system.
- Visualization & Reports
- Axial temperature profiles including boundary temperatures.
- Derating curves and characteristic‑curve diagrams.
- Animated visualization of time‑dependent temperature profiles.
- Graphical result presentation with export as image/report.
- Standards & Interoperability
- Export of circuit diagrams and parameterization for contact systems according to ZVEI and DIN/VDA requirements.
- Structured output for reuse in test and simulation environments.
- Version and parameter log for traceability.
Radial Thermal Analysis
RTA tools (radial thermal analysis of cables) provide fast, reliable temperature predictions across the cable cross‑section. They are particularly suitable when cables are installed as by‑the‑meter stock over long, uniform runs.
+
- VW 60306
- GS 95007-1-3
- MBN 50112-3
- DIN TS 70112-3
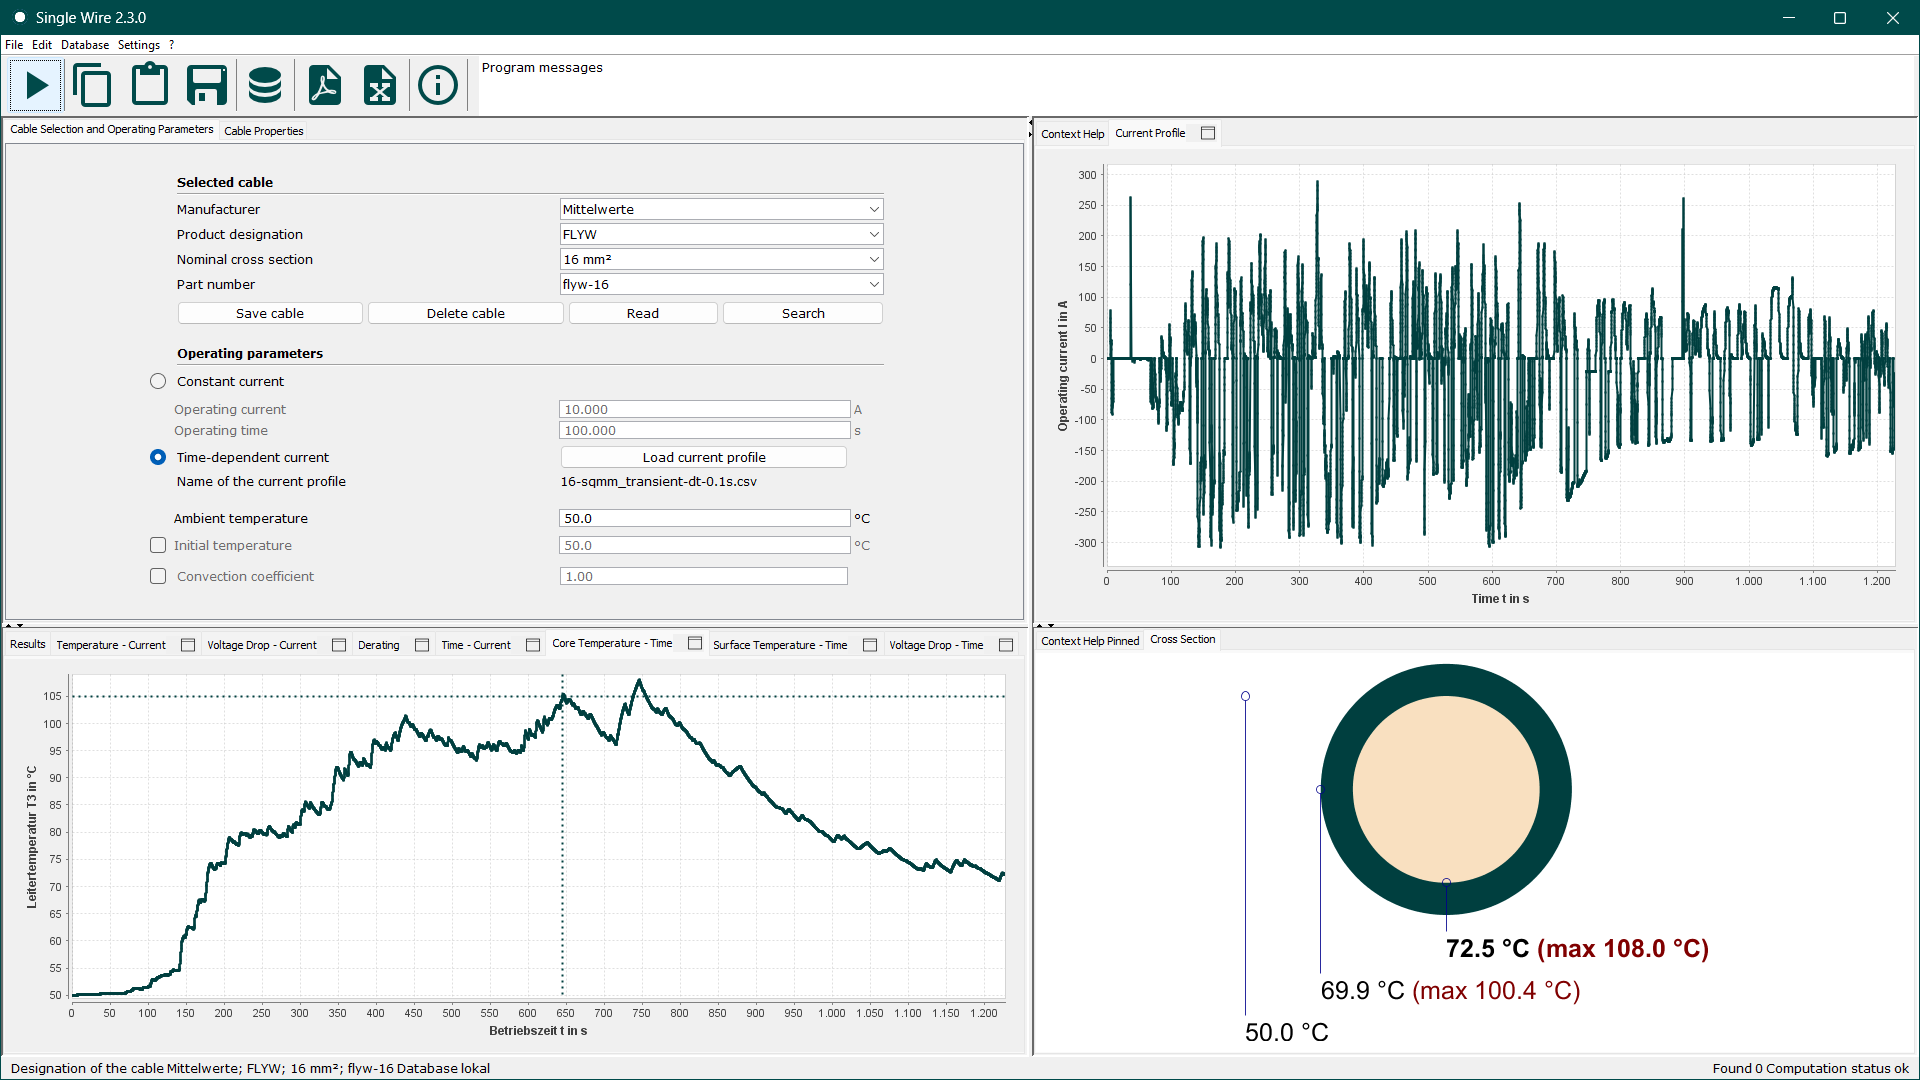
Single Wire Tool
The Single Wire Tool calculates the thermal heating of electrically loaded single conductors and supports their sizing. A clear user interface with charts, an integrated cable database, and flexible export options simplify design, documentation, and downstream processing.
+
- Use & Benefits
- Sizing single conductors under specified load and ambient conditions.
- Quick assessment of temperature margins, derating, and overload capability.
- Transparent result presentation via charts and standardized reports.
- Inputs
- Conductor and insulation parameters: e.g., material, cross‑section/geometry, layer build‑up, relevant material properties.
- Operating parameters: load current profile, ambient and initial temperature, convection conditions.
- Outputs
- Temperature profiles:
T(I),T(t), deratingImax(Tamb), overload curvetmax(I). - Electrical quantities: voltage‑drop profiles
U(t),U(I), power losses. - Characteristic metrics: e.g., thermal time constants, permissible continuous current.
- Temperature profiles:
- Functions
- Cable datasheets and calculation reports as PDF.
- Integrated database for managing single‑conductor records.
- Excel export of results, metrics, charts, and database contents.
- Export of schematics and parameter sets for single conductors according to ZVEI and DIN/VDA specifications.
- Context‑sensitive help within the tool.
- Workflow & Interoperability
- Export of calculation results for further processing in downstream tools (e.g., TNA/RTA) or system models.
- Traceable documentation for reviews and approvals via standardized reports.
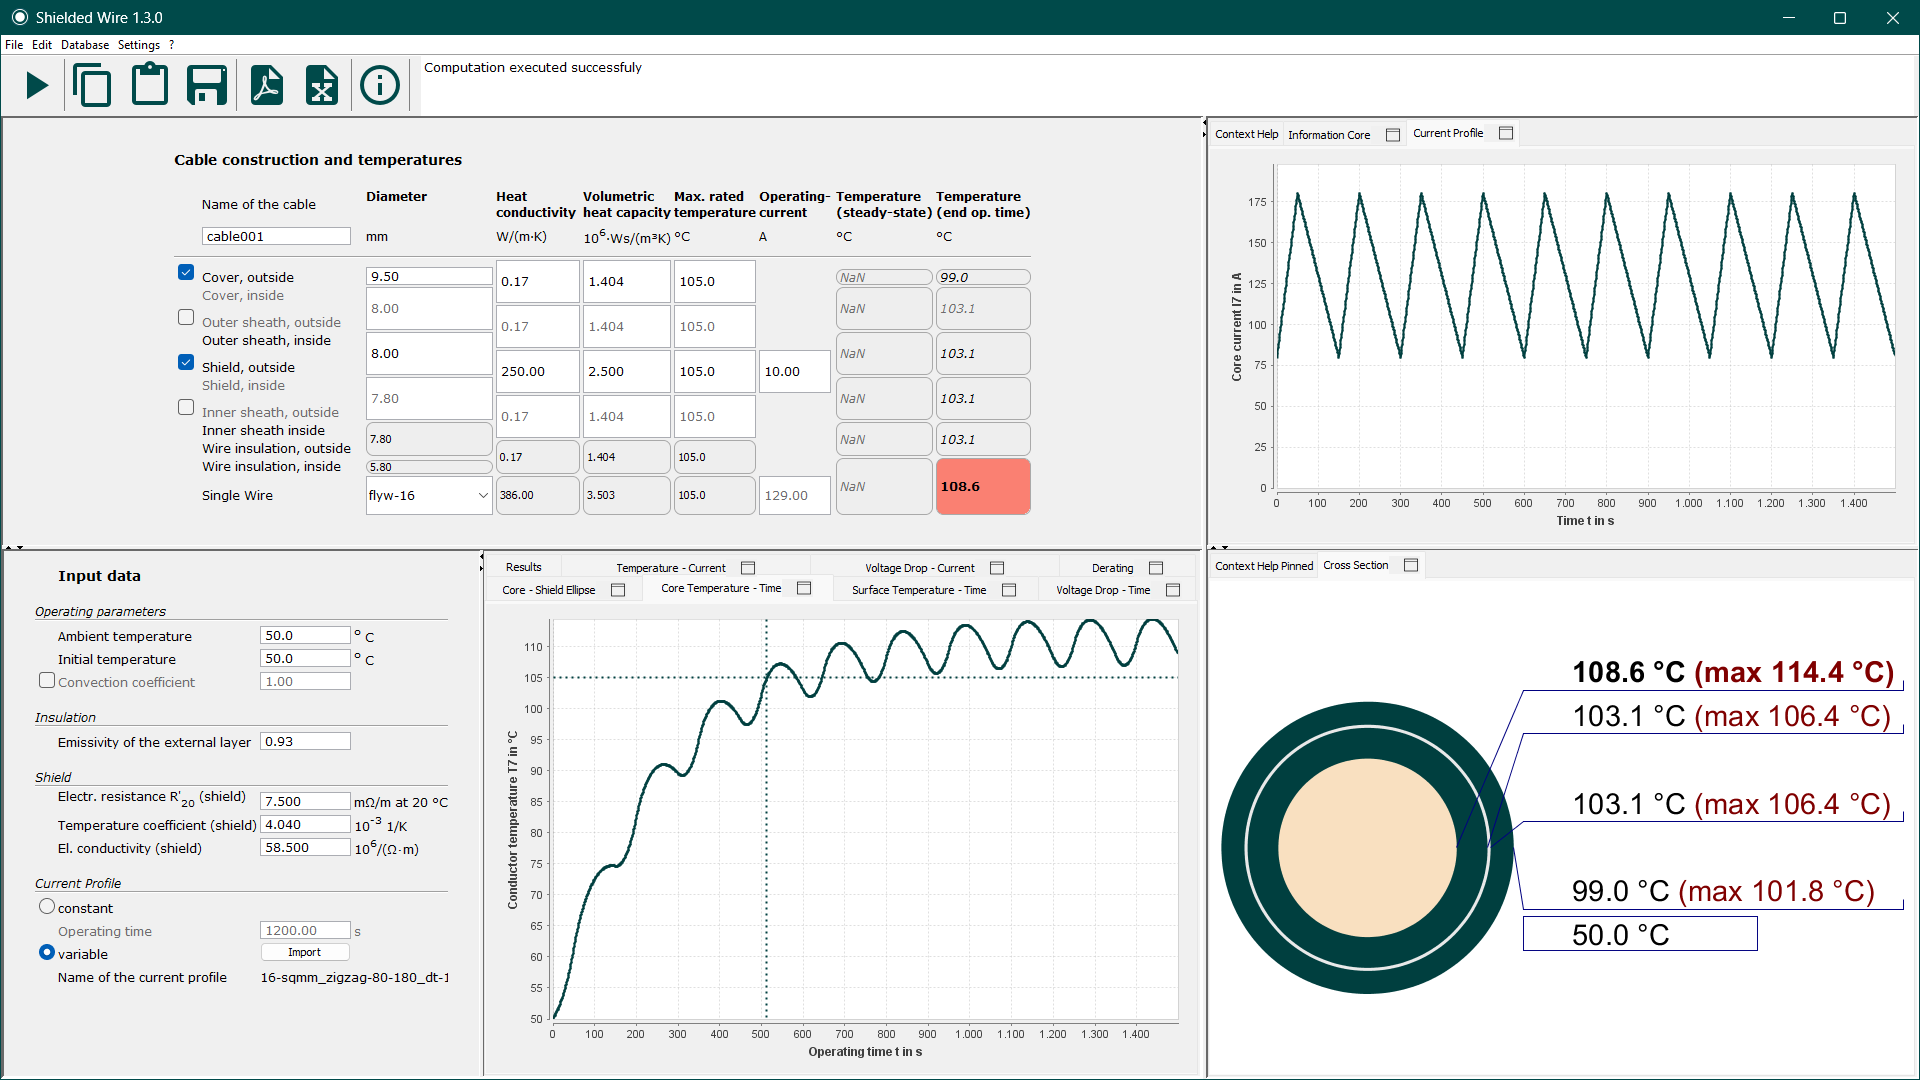
Shielded Wire Tool
As electromobility advances, transporting high electrical power becomes increasingly important. High‑voltage cables with a conductive shield and additional jacket layers impose specific thermal and electrical requirements. The Shielded Wire Tool captures these couplings between core, shield, and coverings efficiently and precisely, supporting standards‑compliant sizing.
+
- Use & Benefits
- Design of shielded high‑voltage cables under realistic load and ambient conditions.
- Assessment of thermal coupling between conductor core and shield, including derating.
- Transparent result presentation via charts, key figures, and standardized reports.
- Inputs
- Cable structure: Import single conductors from the Single‑Wire database; define jacket layers and shield (material, thickness, electrical/thermal properties).
- Operating parameters: current load in core and shield, ambient and initial temperature, convective boundary conditions.
- Outputs
- Temperature and derating curves:
T(t),Imax(Tamb), isotherms for core/shield currentsIcore( Ishield). - Electrical quantities: voltage drop and power loss separately for core and shield.
- Characteristic metrics: thermal time constants, permissible continuous and overload currents, build‑up‑specific thermal resistances/capacitances.
- Temperature and derating curves:
- Functions
- Cable datasheets and calculation reports as PDF.
- Excel export of all results, metrics, and charts.
- Context‑sensitive help within the tool.
- Workflow & Interoperability
- Seamless import of single conductors from the Single Wire Tool; consistent parameter management for shield and jacket layers.
- Export of calculation results for further processing in downstream models (e.g., TNA/RTA) or system simulations.
- Traceable documentation for reviews and approvals via standardized reports.
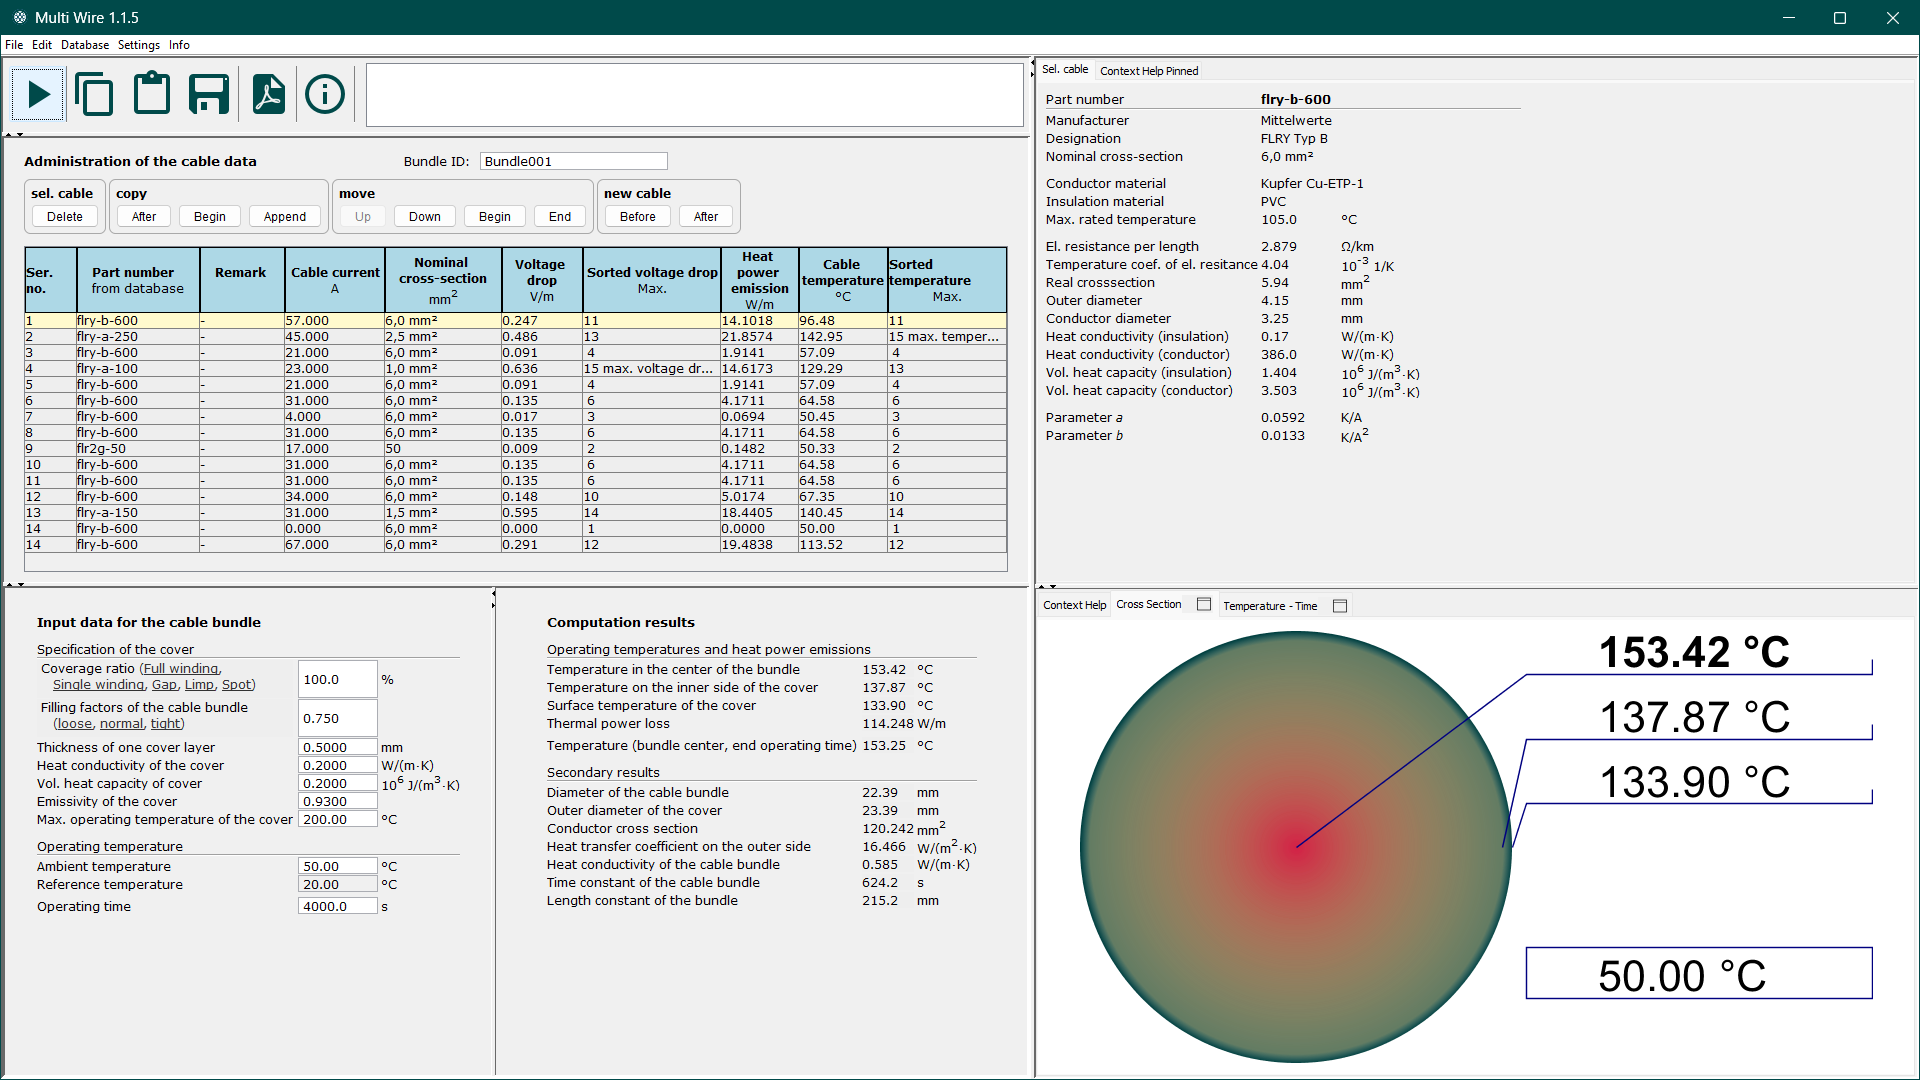
Multi Wire Tool
With direct access to the Single Wire database, the Multi Wire Tool assembles cable bundles and computes steady‑state worst‑case temperatures. In addition, it calculates thermal power losses and voltage drops in the individual conductors. The tool is primarily used for the thermal simulation of wire bundles in the vehicle onboard power system.
+
- Use & Benefits
- Design and assessment of cable bundles under realistic operating and ambient conditions.
- Identification of worst‑case thermal scenarios for each conductor within the bundle.
- Clear, review‑ready documentation via standardized outputs and reports.
- Inputs
- Single conductors: Import from the Single Wire database.
- Wrapping properties: Material, thickness, thermal/electrical characteristics.
- Operating parameters: Ambient temperature and current load per conductor.
- Outputs
- Temperatures: Steady‑state bundle temperature at various layers.
- Electrical quantities: Voltage drops and power losses per conductor and for the bundle.
- Dynamics: Time evolution of the average bundle temperature
T(t). - Bundle characteristics: Diameter, cross‑sectional areas, thermal time constant.
- Functions
- Cable datasheets and calculation reports as PDF.
- Context‑sensitive help within the tool.
- Workflow & Interoperability
- Seamless import of single conductors from the Single Wire Tool to build bundles consistently.
- Results prepared for downstream system and thermal simulations.
- Traceable documentation to support reviews and approvals.
Reliability Analysis
Tools for statistical failure rate analysis determine reliability metrics, such as the FIT rate, from real field data. Their strength lies in the robust estimation of failure probabilities, even when very few or no failures (so-called zero-failure cases) have occurred during the recorded warranty or operational periods.
N‑Tool – Failure Rate Analysis from Field Data (in development)
N‑Tool is a software for determining failure rates of electrical components (e.g., power and data cables, splices, fuses, ground connections) based on field data. It follows the methodology described in the 2nd edition of the technical guideline “Failure Rates for Automotive Wiring System Components – Expected Values and Conditions” (ZVEI / Bayern Innovativ) and assumes a constant failure rate for random failures. Robust, validated statistical methods for cases with zero or few failures are integrated and require no special expertise.
+- Applications & Benefits
- FIT rates derived from real field data—no usage profile assumptions required.
- Compliant in‑house analysis of internal or supplier field data while ensuring compliance and confidentiality.
- What‑if scenarios to assess hypothetical failure patterns.
- Automated, auditable results for reviews and approvals.
- Terminology
- FIT rate: Failures‑in‑Time, standardized failure rate (e.g., per 109 component hours of life time).
- Confidence interval: Lower/upper bound of the FIT rate for a selected confidence level.
- Inputs
- FIT rate type (component‑dependent):
- Unit‑specific (standard; e.g., data cables, splices, fuses, ground connections)
- Length‑specific (e.g., power cables)
- Confidence level: choose 90%, 95%, or a user specified percentage.
- Warranty period: e.g., 3 years.
- Population (component lifetime): direct input or calculation from production volumes across multiple years.
- Known failures: number of justified and unjustified claims.
- Underreporting factor: optional consideration of standardized dark‑figure assumptions.
- FIT rate type (component‑dependent):
- Outputs
- Guideline‑compliant FIT rate: derived from quantity/length, failures, observation period and warranty period.
- Confidence intervals: lower and upper bounds of the FIT rate for the chosen confidence level; the upper bound is highlighted as the decisive value.
- Sample mean of the FIT rate: estimator for a very large population.
- Population results: calculated component lifetime if not provided directly.
- Reports & exports: standardized result reports and CSV export for further processing.
- Functions
- Built‑in robust statistics for zero/low‑failure scenarios (automatic model selection; no expert knowledge required).
- Configurable handling of unjustified claims and underreporting factors.
- Input data validations and plausibility checks.
- Fast export via clipboard as well as file export/import (CSV).
- Standardized, auditable reports including assumptions, parameter log, and key metrics.
- Workflow & Compliance
- Internal, compliance‑conform data handling—no external access required.
- Traceability via versioning and a complete parameter/change log.
- Seamless handover of results to downstream reliability and risk assessments.
Pre- and Post-processing Tools
PSS offers compact solutions for generating dynamic current profiles I(t) as well as for
analyzing and transforming computed temperature profiles T(t).
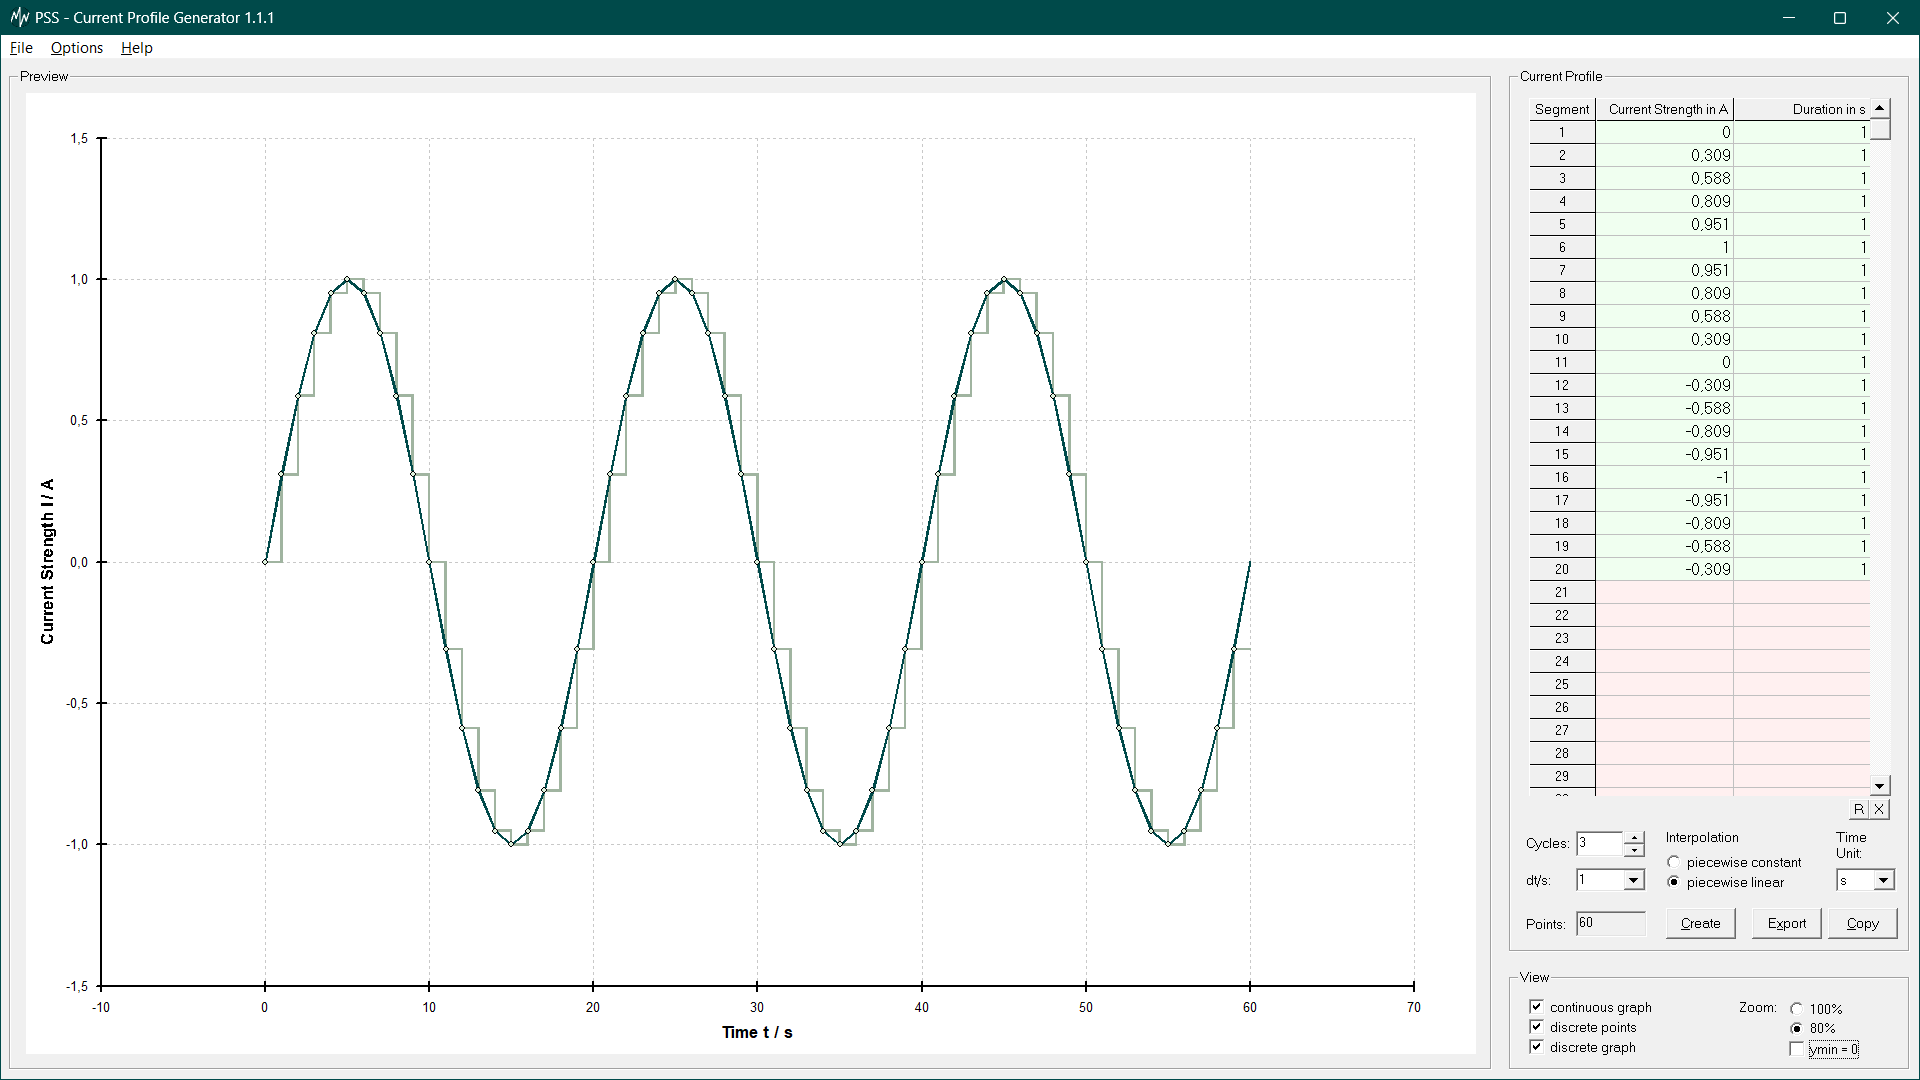
Current Profile Generator (CPG)
The Current Profile Generator (CPG) creates and manages periodic current profiles (current‑time waveforms) for time‑dependent loading scenarios. It ensures that profiles are formally correct, consistent, and compatible with our software tools and can be imported directly by the Single Wire Tool, Shielded Wire Tool, and K Module. In addition, the CPG supports conversion and validation of third‑party data formats.
+
- Applications & Benefits
- Fast creation, editing, and management of periodic current profiles.
- Data quality assurance through plausibility checks and format validation.
- Seamless use of profiles in the Single Wire Tool, Shielded Wire Tool, and K Module.
- Minimization of calculation errors via standardized, tool‑compatible profiles.
- Inputs
- Profile description: sequence of current‑time interval pairs
(t, I). - Interpolation: either constant (stepwise) or linear between data points.
- Periodicity: number of repetitions or total duration.
- Sampling: desired time step or automatic gridding.
- Profile description: sequence of current‑time interval pairs
- Outputs
- Discrete current profile: current‑time pairs as CSV for direct reuse.
- Metadata & validation: log of interpolation, gridding, and check notes.
- Functions
- Lean, exchangeable file/profile format for project‑wide use.
- Suitable for building a file‑based library of current profiles (templates/snippets).
- Quick export via clipboard as well as file export/import.
- Preview of the resulting profile including gridding and interpolation.
- Workflow & Interoperability
- Direct import into the Single Wire Tool, Shielded Wire Tool, and K Module without post‑processing.
- Standardized CSV interface for testing, simulation, and automation.
- Versioning and parameter log for traceability in reviews and approvals.
Temperature Profile Transformer (TPT) (in development)
The Temperature Profile Transformer (TPT) converts given temperature profiles T(t) into
temperature–time characteristics (TTC). The TTC indicates, among other things, how long a component
remains below defined temperatures, whether and for how long limits are exceeded, and whether the
time‑dependent temperature loads comply with the specified temperature class.
By superimposing a temperature‑class‑specific Arrhenius aging curve, compliance or exceedance can be
assessed reliably.
- Applications & Benefits
- Rapid assessment of temperature profiles for compliance with temperature classes.
- Quantification of dwell times below/above defined temperature thresholds.
- Aging estimation by linking to Arrhenius models (e.g., lifetime/acceleration factors).
- Standardized, auditable results for reviews and approvals.
- Inputs
- Temperature profile: time‑resolved sequence of
(t, T)values or curve trace. - Component temperature class: limit/reference temperatures incl. tolerances.
- Time basis: number of profile repetitions or a defined aging period.
- Temperature profile: time‑resolved sequence of
- Outputs
- TTC (temperature–time characteristic): discrete dwell times below/above thresholds in CSV format.
- Arrhenius evaluation: corresponding aging curve and metrics (e.g., cumulative damage) as CSV.
- Key figures report: max/min/median temperature, exceedance durations, equivalent continuous temperature.
- Functions
- Automatic assessment of a temperature profile’s admissibility relative to the class’s Arrhenius curve.
- Configuration of freely selectable temperature thresholds (class and additional thresholds).
- Lean file and exchange format; quick export via clipboard as well as file export/import.
- TTC preview incl. histogram/duration distribution and highlighting of limit violations.
- Suitable for building a file‑based TTC library.
- Workflow & Interoperability
- Standardized CSV interfaces for testing, simulation, and automation.
- Versioning and parameter log for traceability of assumptions and results.
On request we would be glad to send you test versions of our software tools. For more information you may contact us under info@physsolutions.com.